
Stocks to Watch & Index Levels for 06 Nov 2026: Nifty 50, Bank Nifty, Sensex
Pivot, support and resistance levels for Nifty 50, Bank Nifty and Sensex plus technically strong and weak Nifty 50 stocks for 06 Nov 2026.
Key technical levels for the next session, calculated from today’s price action. These are reference levels, not predictions.
Index levels
| Index | Close | Trend | RSI | S2 | S1 | Pivot | R1 | R2 |
|---|---|---|---|---|---|---|---|---|
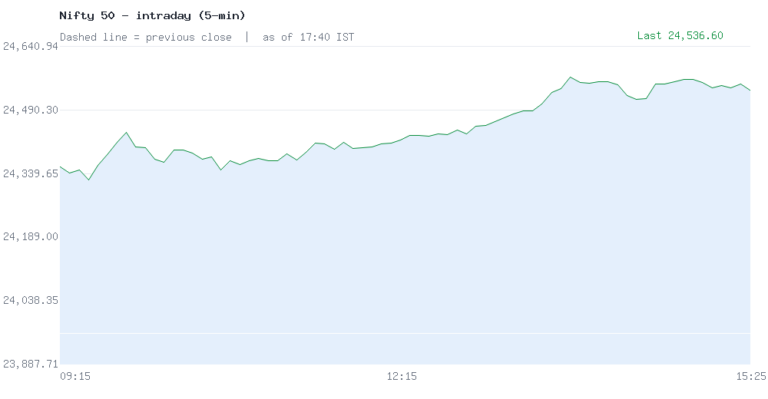
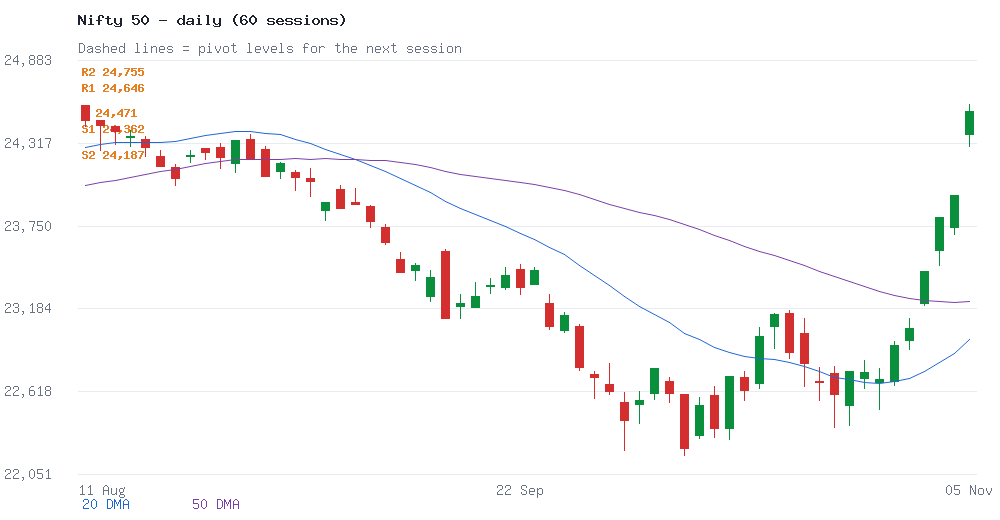
| Nifty 50 | 24,536.60 | Bullish | 75 | 24,187 | 24,362 | 24,471 | 24,646 | 24,755 |
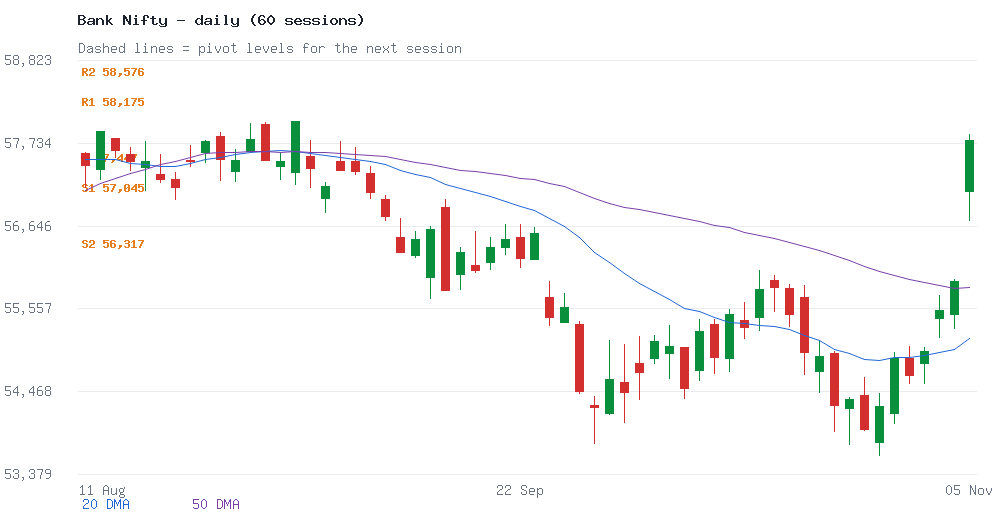
| Bank Nifty | 57,773.65 | Bullish | 69 | 56,317 | 57,045 | 57,447 | 58,175 | 58,576 |
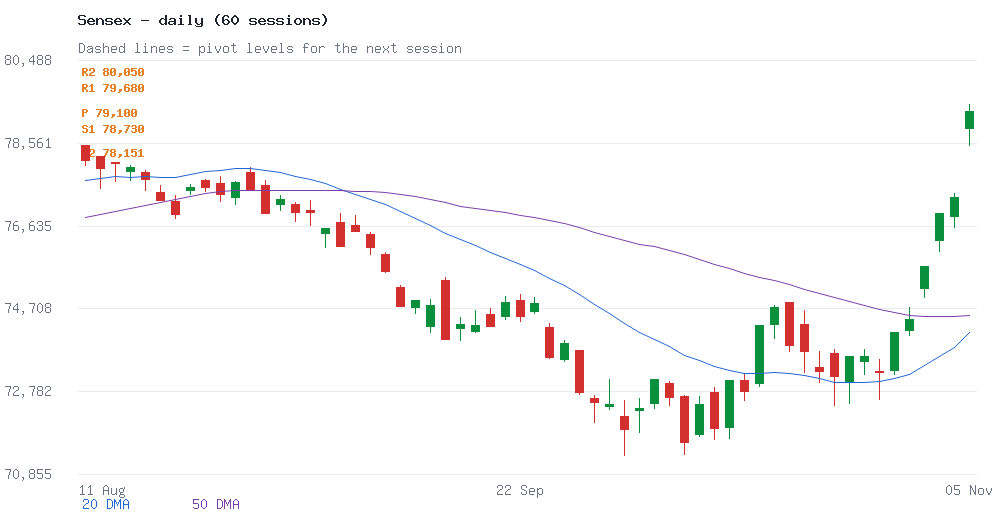
| Sensex | 79,310.01 | Bullish | 76 | 78,151 | 78,730 | 79,100 | 79,680 | 80,050 |
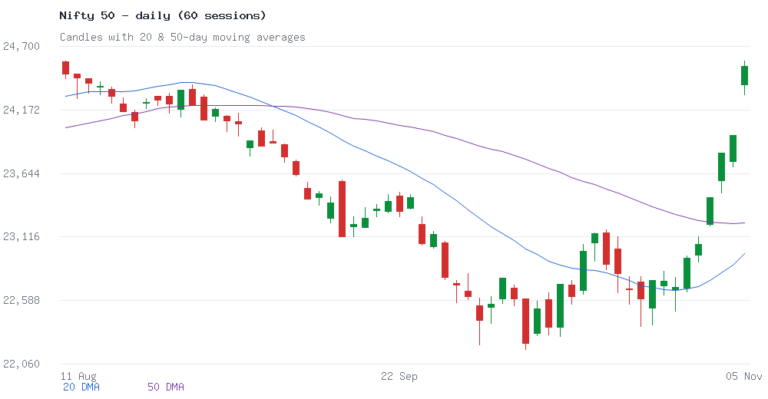
- Nifty 50: trend is bullish (RSI 75). Trading above R1 (24,646) would keep R2 (24,755) in focus; a slide below S1 (24,362) would shift attention to S2 (24,187). Pivot: 24,471.
- Bank Nifty: trend is bullish (RSI 69). Trading above R1 (58,175) would keep R2 (58,576) in focus; a slide below S1 (57,045) would shift attention to S2 (56,317). Pivot: 57,447.
- Sensex: trend is bullish (RSI 76). Trading above R1 (79,680) would keep R2 (80,050) in focus; a slide below S1 (78,730) would shift attention to S2 (78,151). Pivot: 79,100.
Stocks showing strength
| Stock | Close | Chg % | S1 | R1 | Technical observations |
|---|---|---|---|---|---|
| BAJFINANCE | 1,070.00 | +7.65% | 1,035.1 | 1,089.9 | above 20 & 50-DMA, RSI 70, volume 3.5x, near 20-day high |
| M&M | 3,127.50 | +5.59% | 3,026.1 | 3,186.9 | above 20 & 50-DMA, RSI 68, volume 3.8x, near 20-day high |
| MARUTI | 12,652.00 | +5.48% | 12,374.3 | 12,805.3 | above 20 & 50-DMA, RSI 70, volume 2.6x, near 20-day high |
| BAJAJFINSV | 1,835.00 | +4.47% | 1,791.4 | 1,863.7 | above 20 & 50-DMA, RSI 66, volume 1.3x, near 20-day high |
| ETERNAL | 358.30 | +4.01% | 349.3 | 363.5 | above 20 & 50-DMA, RSI 67, volume 1.4x, near 20-day high |
| EICHERMOT | 7,713.00 | +3.95% | 7,563.7 | 7,787.7 | above 20 & 50-DMA, RSI 67, volume 2.4x, near 20-day high |
| JIOFIN | 229.62 | +3.31% | 225.7 | 232.5 | above 20 & 50-DMA, RSI 65, volume 2.4x, near 20-day high |
| HDFCBANK | 760.00 | +3.16% | 751.8 | 765.4 | above 20 & 50-DMA, RSI 68, volume 2.2x, near 20-day high |
Stocks under pressure
| Stock | Close | Chg % | S1 | R1 | Technical observations |
|---|---|---|---|---|---|
| COALINDIA | 394.30 | -1.34% | 390.8 | 400.1 | below 20 & 50-DMA, volume 1.9x |
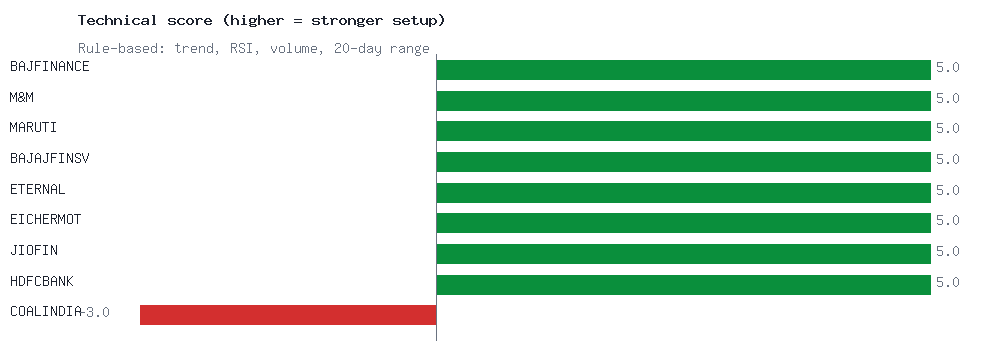
Method: +2/-2 for trend vs 20 & 50-DMA, +1/-1 for RSI zone, +1/-1 for volume expansion with direction, +1/-1 for proximity to the 20-day high/low. Pivot levels use the classic (H+L+C)/3 formula.
Disclaimer: This post is auto-generated from exchange data for educational and informational purposes only. It is not investment advice or a recommendation to buy or sell any security. Levels and indicators are mechanical calculations and may be wrong. Please consult a SEBI-registered adviser before making investment decisions.